Role: Design Researcher
Timeline: Aug 2022 – Dec 2022
Team: Collaborated with the Design Research Team & Crown Corporate Stakeholders
Methods: Semi-Structured Interviews (N=76), Thematic Analysis, “Value Bucket” Mapping, Stakeholder Workshops
Executive Summary
Challenge: Crown Equipment Corp. migrated its service technicians from a legacy web portal to a new native app, “Crown 360,” to streamline part tracking. However, the rollout faced significant resistance and user complaints. The product team needed to understand why adoption was stalling and which fixes would yield the highest ROI.
Approach: I executed a massive qualitative study, interviewing 76 employees across 7 distinct departments (Service, Sales, Parts, etc.). Instead of a simple bug report, I utilized a Value Bucket framework to aggregate hundreds of isolated complaints into cohesive, actionable themes linked to business value.
Outcome: The research identified critical failures in Data Synchronization and Reporting Workflows. By presenting these findings via a quantified “Value if Fixed” model, I successfully aligned diverse stakeholders on a prioritized roadmap for the application’s redesign.
Context: A Complex Ecosystem
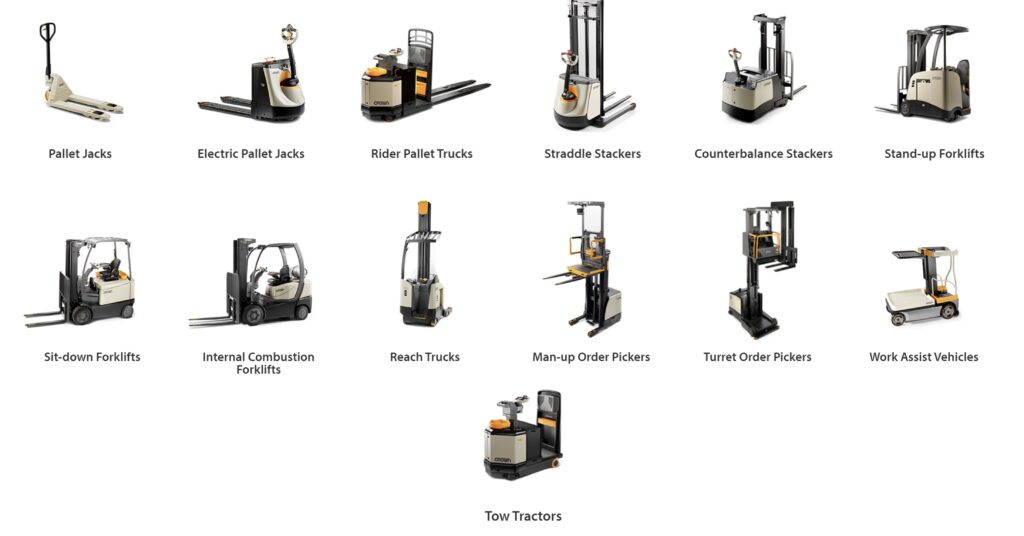
Service Problem: Crown manufactures 85% of its parts in-house. When a forklift breaks down, speed is everything. Technicians previously used a desktop portal to find parts, often calling centers manually. The new “Crown 360” app promised mobility but introduced new friction.
Stakeholder Limitation: With users ranging from Branch Managers to Field Technicians, internal feedback was noisy and conflicting. Stakeholders couldn’t distinguish between “minor bugs” and “workflow blockers.”
Methodology: Scaling Qualitative Research
Large-Scale Interviews (N=76) I conducted 76 semi-structured interviews via Zoom, transcribing and tagging hundreds of hours of feedback.
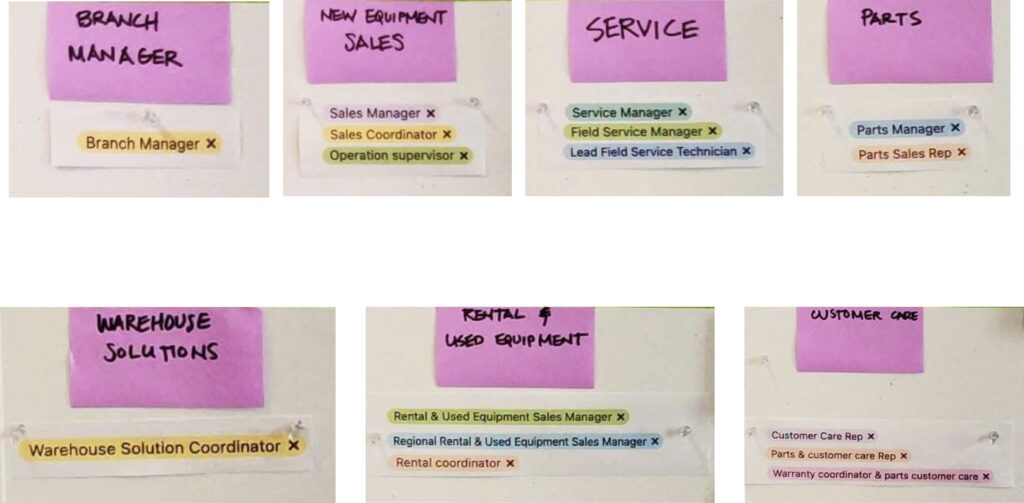
- Scope: Covered 7 user archetypes including New Equipment Sales, Rental Managers, and Field Service Techs.
- Analysis: I used Airtable to tag and categorize raw feedback into four primary pillars:
- Reporting
- Support
- Data Synchronization
- User Experience (General)
Key Insights & Strategy
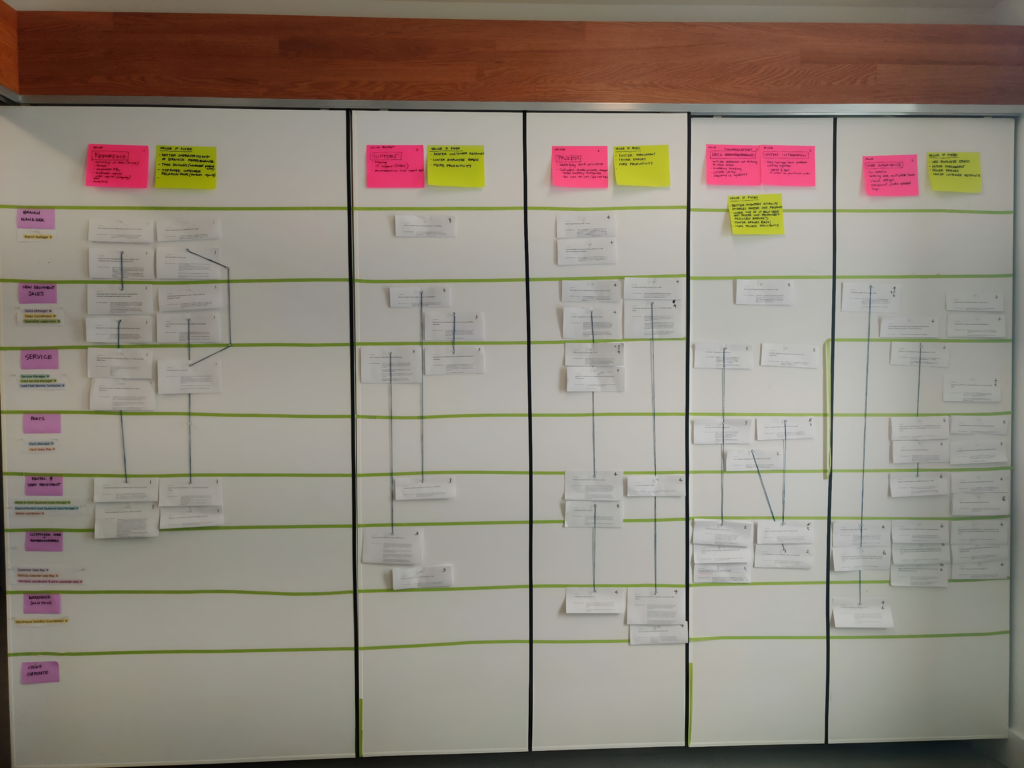
The “Value Bucket” Framework
To make qualitative data “speak business,” I created Value Buckets.
- Concept: Instead of listing 50 small bugs, I grouped them into “Buckets.” If a bucket contained 15 related pain points, fixing the root cause would solve all 15.
- Metric: Each bucket was assigned a Value if Fixed score, helping stakeholders prioritize high-impact engineering efforts over low-value tweaks.

The Synchronization Gap
- Insight: The biggest friction point wasn’t the UI, but Data Synchronization. Field techs worked in areas with poor signal, and the app failed to sync offline data correctly, leading to lost part orders.
- Impact: This insight shifted the roadmap from “UI Polish” to “Backend Reliability.”
Impact: Creative Communication
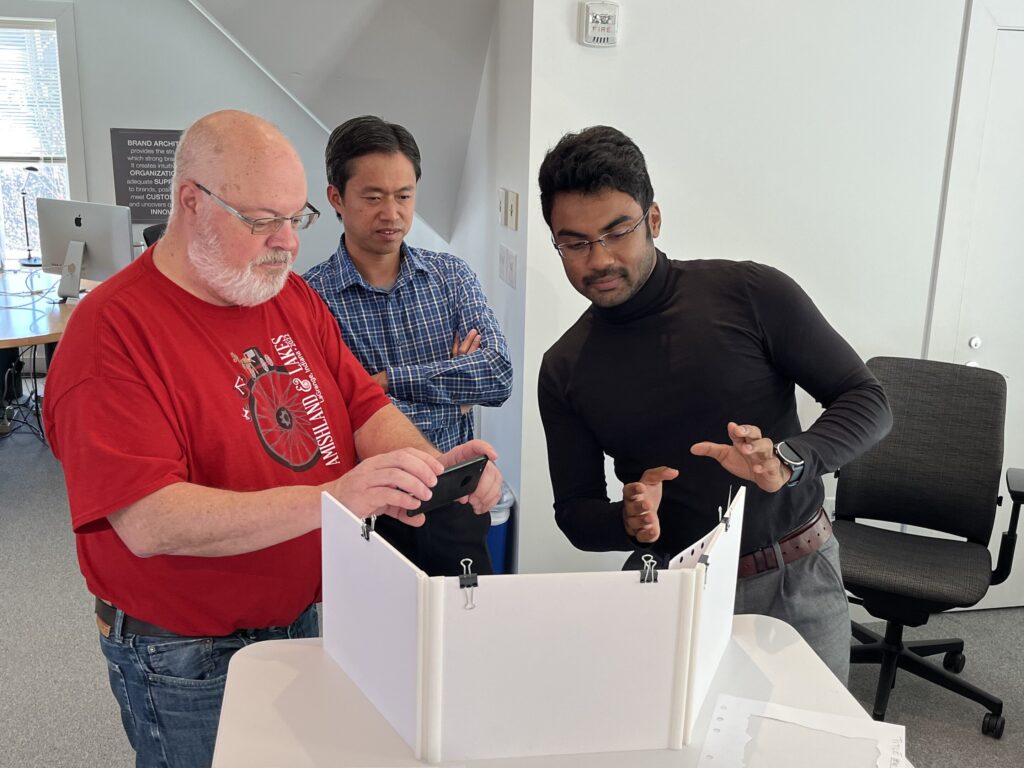
The Lego Simulation: Presenting to corporate stakeholders requires clarity. To prepare for the final presentation, I built a physical Presentation Mockup using Lego figurines.
- Why? It allowed the design team to simulate the boardroom dynamic, anticipating stakeholder objections and refining our storytelling flow before the actual meeting.
- Result: The final presentation successfully secured buy-in for the prioritized roadmap.